

SEBASTIEN MENARD
he/him | age 13 | Kingston, ON
Best of Fair - Gold Medal, Frontenac, Lennox and Addington Science Fair 2022 | Gold medal - Computer and Engineering (Junior), St. Lawrence College President’s Award, Queen's University School of Environmental Studies Award, Invista - Innovation and Entrepreneurship Award, Excellence Award (Junior) - Silver Medal, and Challenge Award - Environment and Climate Change (Junior), Canada-Wide Science Fair 2022
Edited by Tristan Montoya
INTRODUCTION
An urban area which is warmer than the surrounding rural areas is known as an urban heat island. Heat islands heat up the entire city, both surface temperature and air temperature. As the solar heat absorbed by dark surface areas and structures is released slowly at night, there is little relief from heat in the evenings. The urban temperature is estimated to be 1 °C to 3 °C warmer than surrounding areas. In the evening, the difference between urban and rural temperatures can be as high as 12 °C (Guilbault et al., 2016).
Urban heat islands have health, social, economic, and environmental impacts. Vulnerable community members are especially at risk. For example, people living in substandard housing may not have access to air conditioning and are more likely to live in built-up areas that trap more heat through the heat island effect. This can lead to health effects such as cramps, heat stroke, dehydration, and death (Toronto Medical Officer of Health, 2013).
Cool roofs can help lower indoor temperatures, particularly on the top floors of buildings. A cool roof is defined as a roof that stays cool in the sun by reflecting sunlight (to minimize solar absorption) and emitting thermal radiation (to help dissipate solar heat gain) (Glossary | Heat Island, n.d.). When used on several buildings within a community, cool roofs can help reduce local air temperatures and lower peak electricity demand (Guilbault et al., 2016).
My science fair project aims to figure out what colour and type of roofing materials absorb the least amount of heat. I chose this topic because urban heat islands are a real problem and I want to help get rid of them.
HYPOTHESIS
My hypothesis states that the white steel roofing material will absorb the least heat from the sun. I made this hypothesis because from what I learned, white reflects all visible light. The white steel shingle was the whitest sample on the board. My independent variables are the colour and material of roofing, and my dependent variables are the change in temperature of each roofing material over one hour, and the fraction of reflected light in the infrared range.
PROCEDURE
To complete my experiment, I created a wood board with differently coloured types of roofing materials. Double-sided tape was used to secure the steel metal roofing samples, a staple gun was used to attach the asphalt shingles and lastly, a sample case of aluminum shingle samples was borrowed from a roofing company.
Next, the sample roofing materials were exposed to direct sun. Temperature measurements were taken of each piece of roofing every 10 minutes, for one hour. The experiment was repeated on three different days with approximately the same conditions.
To measure the temperature, black construction paper was wrapped around the end of the infrared thermometer, forming a cylinder. This allowed for a constant distance from the roofing materials and blocked any sunlight from affecting the infrared thermometer measurements.
In addition, a spectrometer was constructed out of wood. Plywood was cut to create a rectangular prism box, with a thin slit at the front. The inner surfaces were painted black. The infrared filter from a USB webcam was removed and a diffraction slide was glued to the webcam (How to Convert a Webcam to a Near-Infrared Camera, 2018). The webcam was attached to the back of the plywood box, and it was oriented at a 30-degree angle from the incoming light as shown in Figure 1. Theremino software (www.theremino.com) was utilized for analyzing the spectrometer raw data. The spectrometer was calibrated using a compact fluorescent lightbulb. The spectrometer was pointed at each roofing material exposed to direct sunlight to acquire the individual light spectra. The experiment was repeated over three separate days.

Figure 1: Diagram of a spectrometer.
RESULTS

Figure 2: Average change in temperature over a period of 60 min for various shingle colours and materials.
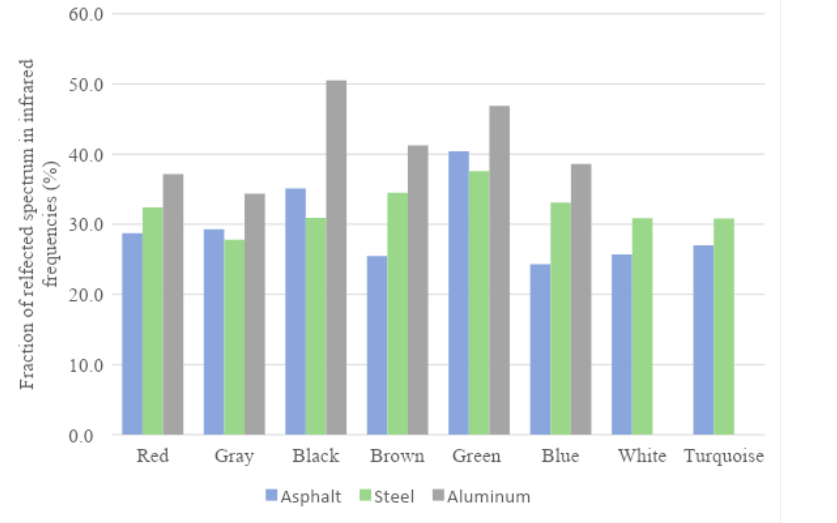
Figure 3

Figure 4: Reflected spectrum in daylight for black asphalt

Figure 5: Reflected spectrum in daylight for black aluminum
Figure 2 demonstrates that asphalt is the warmest material and aluminum is the coolest. The darkest colours (black and brown) are the warmest. Lighter colours (white and grey) are the coolest. Error bars represent standard deviation.
Figure 3 demonstrates that aluminum reflects the largest fraction infrared light in all colours, and asphalt reflects the smallest fraction infrared light. These results show the black aluminum is reflecting the most infrared light. Black aluminum is also one of the coolest roofing materials measured according to Figure 2.
Figures 4 and 5 show the analyzed spectrum from the Theremino software, displaying relative light intensity at various frequencies. Figure 4 shows that the reflected spectrum of the black asphalt contains little reflected infrared light. Figure 5 demonstrates that the reflected spectrum of the black aluminum material contains proportionally more infrared light. Frequencies above 700 nm were considered in the infrared spectrum.
DISCUSSION & CONCLUSIONS
Overall, my hypothesis is supported. White metal was measured to be the coolest. My experiment also demonstrates non-visible light reflectance affects temperature, specifically for infrared light. The ability of paint to reflect infrared light can play an important role in reducing the heat of an object. For example, the black aluminum paint is cooler than all the asphalt colours, and this may be related to its high infrared reflectance. Aluminum shingles were not available in white or turquoise; however, these colours should be included for a complete data set.
There were sources of errors in my experiment. Firstly, my measurements had a large standard deviation, meaning the measurements varied significantly between the three trials performed for each material and colour. Increasing the number of experiments could have lowered the standard deviation. In addition, some environmental variables including cloudy patches and wind variability couldn’t be controlled. It took about one minute to take each temperature measurement, bringing in a time variability. Lastly, we utilized an infrared thermometer, which could vary from the true surface temperature.
This data could be used in daily life to make cooler cities by reducing the amount of heat emitted by roofs. Residential homeowners and commercial building owners could use this information when selecting roofing material and colour. Based on the results of my experiment, lighter coloured roofs are preferable to dark ones, and aluminum is preferable to steel or asphalt. These cooler roofs could reduce the effect of heat islands in communities.
For future studies, we could measure the temperature of various roofing materials on installed roofs, and over a longer amount of time. This information could be cross-referenced with a housing unit’s electrical usage to measure possible energy savings.
ACKNOWLEDGEMENTS
Alexandre Ménard, Parent, for providing access to power tools and guidance in constructing the spectrometer. Karly Holmes, Parent, for providing editing and formatting advice and teaching me how to use excel formula functions for standard deviation. Stephen Brown, CWSF Mentor, for providing feedback on the project report and Project Board.
references
Automation. (n.d.). Theremino. Retrieved November 10, 2021, from https://www.theremino.com/en/downloads/automation#spectrometer
Burns, D. [Dan Burns]. (2018, September 6). How to Convert a Webcam to a Near-Infrared Camera [Video]. YouTube. https://www.youtube.com/watch?v=ihuHuC12328
Edinburgh Instruments. (2015) What is a Spectrometer? Edinburgh Instruments. https://www.edinst.com/blog/what-is-a-spectrometer/
Guilbault, S., Kovacs, P., Berry, P., & Richardson, G. R. A. (2016). Cities Adapt to Extreme Heat: Celebrating Local Leadership. Institute for Catastrophic Loss Reduction. https://www.iclr.org/wp-content/uploads/PDFS/cities-adapt-to-extreme-heat.pdf
Heat Island Group. (n.d.) Glossary. Berkeley Lab. Retrieved February 5, 2022, from https://heatisland.lbl.gov/glossary#Cool_roof
Heat Island Group. (n.d.) Glossary. Berkeley Lab. Retrieved February 5, 2022, from https://heatisland.lbl.gov/glossary#Thermal_emittance
McKeown, D. (2013). Exploring Health and Social Impacts of Climate Change in Toronto. City of Toronto. https://www.toronto.ca/legdocs/mmis/2013/hl/bgrd/backgroundfile-62786.pdf
Merriam-Webster. (n.d.) Emittance. In Merriam-Webster.com dictionary. Retrieved February 5, 2022, from https://www.merriam-webster.com/dictionary/emittance
Merriam-Webster. (n.d.) Reflectance. In Merriam-Webster.com dictionary. Retrieved February 5, 2022, from https://www.merriam-webster.com/dictionary/reflectance
The Regional Municipality of Durham. (2018). KEEPING OUR COOL Managing Urban Heat Islands in Durham Region. https://www.durham.ca/en/regional-government/resources/Documents/Council/ChairStatements/Durham_Heat_Island_AODA-300418.pdf
about the author

Sebastien Menard
My name is Sebi, I am a 13-year-old student from Kingston, Ontario. Throughout the year I participate on a FIRST Robotics Competition (FRC) team and play the Euphonium in a youth orchestra. During the summer I enjoy kayaking, rowing, tennis and swimming. In fall and winter, I hike, alpine and cross-country ski and snowshoe. In my spare time you can find me with my nose in a book. I love reading. I was motivated to undertake this project because my family was replacing our roof and I was curious to investigate how different roofing materials behaved in the real world.