

AFFAAN ABID
he/him | age 17 | Saskatoon, SK
2nd Place Silver Senior Award and Sanofi Biogenius Canada Award for Best Biotechnology Project in SK, 2021 Saskatoon Regional Science Fair | Excellence Award: Bronze Medallist, 2021 Canada-Wide Science Fair
Edited by Josiah McNutt
BACKGROUND & INTRODUCTION
Capsule endoscopy (CE), first introduced in 2000, facilitates non-invasive examination of the gastrointestinal (GI) tract using remote digital imagery (Shim et al, 2017). It as an emerging technology in the medical imaging industry as currently the most common procedures include ultrasound, CT scans, and colonoscopy. All current internal medical imaging technology must be capable of detecting abnormalities such as internal bleeding. Approximately two million people die on an annual basis from hemorrhaging, thus marking it as a significant world issue needing to be addressed (Holland, 2018). Our current technology is not satisfactory nor accurate enough for gastroenterologists for performing medical diagnosis thus calling for an alternative solution. The idea of having a reliable and accurate ingestible technology addressing this requirement is a welcomed tool for the medical industry. Current research from the University of Saskatchewan by Dr. Khan Wahid of the College of Engineering shows great promise in developing a method, capable of combatting this potentially fatal world illness (U of S 2016). Dr. Wahid has led research in developing a CE pill that is capable of detecting various gastrointestinal abnormalities including internal bleeding (U of S 2016). In this project, I have investigated developing a spectroscopy-based application that has the capability of detecting the presence of blood found among many samples. With future research, this application can be integrated with CE as a tool to identify internal bleeding inside patients, thus improving our current ability and methods for diagnosis.
OBJECTIVE & PURPOSE
The objective and purpose of this experiment is to develop a computer model which will be capable of predicting GI bleeding compared to other mixed fluids observed in the digestive tract. The AS7262 spectral sensor will be used (with the capsule endoscopy pill) to evaluate images using the light spectrum in the 450-650 nm wavelengths (V: Violet – 450 nm, B: Blue – 500 nm, G: Green – 550 nm, Y: Yellow – 570 nm, O: Orange – 600 nm, and R: Red – 650 nm), (Ghosh et al. 2014, 2018). Endoscopy procedures currently do not have the ability to differentiate between the presence of blood versus other fluids found in the GI tract.
HYPOTHESIS
It is hypothesized that the AS7262 spectral sensor, will collect and present data appropriate for all experimental samples used to identify their positions on the light spectrum. This application will contribute towards investigating circumstantial outcomes related to internal bleeding with the use of an ingestible endoscopy capsule.

Figure 1: Endoscopy Pill (PillCam™ SB 3 Capsule), Similar to Dr. Wahid’s Innovation, University of Saskatchewan - An Ingestible Camera Pill Able to Detect Potential Abnormalities Located Within the Gastrointestinal Tract and Internal Bleeding
MATERIALS & METHODS
Materials used in the experiment included an AS7262 spectral sensor, jumper wire, Arduino UNO microcontroller, test samples (water, hemoglobin, coffee, orange juice, apple juice, beet juice, pomegranate juice, red Jell-O, ginger ale, tea, ketchup, chilli sauce, beef broth, chicken broth, food colourings), examination chamber (interior must be black with no light able to enter), microscope slides, pipette/dropper. All liquid samples (including pig intestine) were purchased from local supermarkets and grocery stores. Bovine hemoglobin was provided by the University of Saskatchewan, College of Engineering.
A. Computer interface setup and downloading AS7262 spectral sensor library for data collection.
The AS7262 Arduino library was downloaded and the code was upload to the Arduino Uno board. Ensure that the serial monitor is open to allow for copy and pasting of data while running experimentation.
B. Preparation of samples for experimentation.
Next, the hemoglobin base solution is prepared by adding 75 mL of water with one teaspoon of the hemoglobin powder until solution is saturated. Protocol for preparation of all 17 samples can be found within lab journal attached. Additionally, to create the second concentrations of all the samples, add 175 mL of water to the 25 mL of the sample in its original form. (Note: depending on samples, not all will require 3 concentrations.) The hemoglobin concentration was created by adding 2 drops (0.083mL) of the bovine hemoglobin saturated solution to the second or original concentration depending on the sample. After completion of sample preparation, a small project box was constructed (approx. 10 cm x 10 cm, full black interior) with a small opening at the top for the spectral sensor. An adjustable platform was also created to allow the sensor’s eye to be positioned 0.5 cm and 1.0 cm above the sample.
C. Spectral testing
When beginning actual experimentation, a cut piece of the pig intestine tissue was placed on top of a microscope slide (~3mm x 5mm). For all the non-hemoglobin samples, 3 drops of the selected liquid was added on top of the pig intestine. For the samples containing hemoglobin, 2 drops of the hemoglobin base were applied to the liquid concentration. The data reading from the serial monitor in the first position (microscope slide placed horizontally) was collected for 10 seconds. This was repeated for 10 seconds in the sample’s second position (microscope slide placed vertically). Repeat testing protocol for all concentrations for each sample at both distances (0.5 cmand 1.0 cm the sensor.) The above procedural steps in section C were repeated for testing of all remaining samples.
D. Data Analysis – Interpreting numerical data captured from AS7262 spectral sensor
When interpreting the collected data, all raw numerical data was organized in excel spreadsheets for all samples. After, the results were synthesized, and conclusions were drawn with reference to the light spectrum. Refer to the AS7262 datasheet for interpreting significance of different wavelengths. Finally, graphs were created for all tested samples and compare analysis of all gathered information.
Both independent and dependent variables were present in the experiment along with constants. The independent variables included volumes of independent mixing solutions (concentration droplets using pipettes), water content of different concentrations, and sample exposure time. The dependent variables included concentration amounts, sample testing height in examination chamber (either 0.5 or 1 cm), and wavelength measure of specific samples. The constants of the experiment were Arduino software and the spectral sensor, sample testing methodology and protocol, sample testing time, and exposure to on-chip LED light.

Figure 2: Schematic/visual representation of experimental design and setup.
RESULTS & OBSERVATIONS
The outcome of this project was to seek and highlight spectroscopy results achieved using spectral analyzation to differentiate unique samples. Different liquids were experimented with on pig intestine tissue using the AS7262 spectral sensor. The sensor produced raw numerical data for each unique sample. This data was subsequently evaluated in reference to the light spectrum.
Results in the experiment showed that the AS7262 spectral sensor was able to identify and differentiate the colour wavelengths of most samples including those containing hemoglobin. With further validation of this model, this application can be developed as a potential solution towards detecting GI bleeding using an on-chip sensor for capsule endoscopy (Mohebbian et al, 2020). See figures below explaining results.

Figure 3: Coffee sample compared to distilled water (reference). O and R values are greater in hemoglobin added samples.

Figure 4: Beef broth sample compared to distilled water (reference). O and R values are greater in hemoglobin added samples.

Figure 5: Ketchup sample compared to distilled water (reference). O and R values are lower in hemoglobin added sample for ketchup. Demonstrates error in experiment. Hemoglobin colour is brown, could’ve affected on ketchup sample’s results by retracting natural red colour of ketchup.
DISCUSSION
After analysis of results, it was observed that the hypothesis of the experiment was proved correct.
In addition, it can be accepted that some reasoning for the unexpected errors of results can be due to cross-contamination between different samples examined. Overheating of the sensor also could have contributed towards the spectral sensor generating inaccurate and erroneous data.
While testing, it was observed that by changing the distance of the same sample, in most cases, the optical properties of the sample remained unchanged. As a result, the spectral data remained intact. Furthermore, this proves that if a second non-hemoglobin same sample testing’s (different concentration – part water, part original) graph is shifted, all points (wavelengths) will fit to the original sample’s graph. This is most probable when excluding errors present in the experiment.
Another important observation extracted from the experiment was the effect of adding hemoglobin to most of the samples. It was observed that adding hemoglobin to the sample led to a change in optical properties of the sample. As a result, the spectrum for some of the wavelengths were affected. In such cases, if the original sample’s (pure) graph were to shift, not all of the points (wavelengths) will fit to the hemoglobin added sample. However, this pattern will be detected when the sample’s testing distance is changed.
When using distilled water as a reference point, it was observed that all hemoglobin added samples’ O (600 nm) and R (650 nm) wavelength values were always greater.
Summarizing, important results to take account for are when the distance of the same sample is changed, the reflection values and total graph should be lower compared to the original. This result is due to the change in reflection of light from the sensor. Secondly, by adding hemoglobin to samples, in most cases values for wavelengths O (600 nm) and R (650 nm) were increased.
A critical question to answer with further advancement of this project is how an application can be developed to distinguish between identifying hemoglobin samples and the change in distance of the spectral sensor. For future considerations it is proposed that an experimental algorithm can be developed to differentiate between these two factors, and/or the interconnected relationship which exists between these two elements. For an example, if the hemoglobin sample wavelengths are divided by the non-hemoglobin sample wavelengths, a comparative ratio/factor can be established to highlight differentiation among the two values.
CONCLUSIONS
The purpose of this experiment was to develop a computer model to analyze and compare dissimilar coloured liquids and determine where they lie on the light spectrum. To perform this experiment, an AS7262 spectral sensor was used with an Arduino centered program. It was hypothesized that the AS7262 spectral sensor would collect raw numerical data applicable to all experimental samples. If this application proves to be practical, it can be presented as a solution towards early-stage detection of internal bleeding (Wahid et al, 2020). The motivation behind this project was to develop an application capable of addressing this fatal issue after having a close family relative die from internal bleeding.
The results of the experiment showed the hypothesis was correct however, not all results reflected comprehensible data.
While it was not anticipated that some results would be vague, it was expected that some data collected from the sensor could beinaccurate as a result of human and systematic errors. As hypothesized, the overall results of the total experiment showed that the AS7262 spectral sensor was able to identify and differentiate the colour wavelengths of most samples including those containing hemoglobin. It was observed that 12 out of the 17 hemoglobin added samples showed accurate representation of wavelengths on the light spectrum. See table below explaining specific samples.
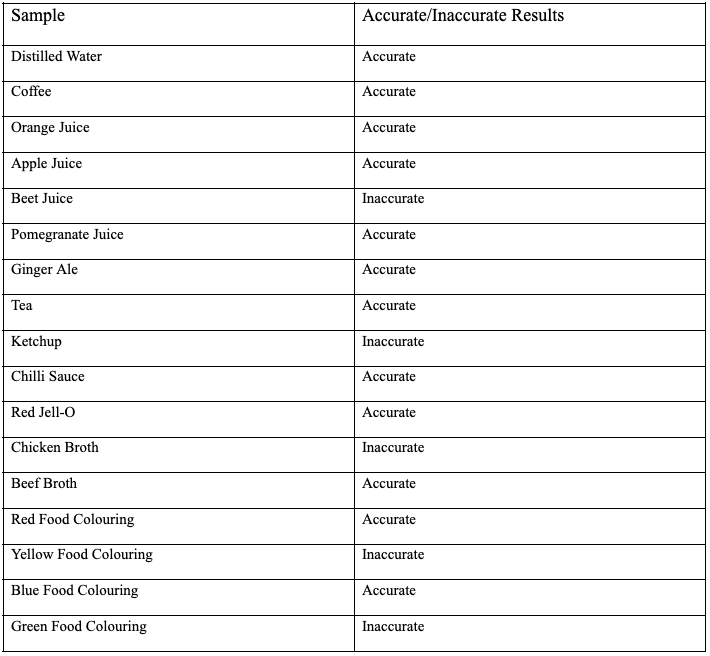
Figure 6: Table outlining which samples produced accurate representation of wavelengths on the light spectrum from experimentation
Altogether, these results indicate promise of developing a comprehensive spectral sensor application to be employed with capsule endoscopy technology, with an eventual goal to detect internal bleeding in the GI tract.
SOURCES OF ERROR & LIMITATIONS
As with any scientific experiment, chances of errors effecting results can never be reduced to zero. Human errors to account for with further advancement of the project include increasing sanitization/cleanliness, preventing cross-contamination, consistent universal sample preparation (creation of solutions), and consistent slide preparation for testing. Systematic errors to address include maintaining consistent concentrations of samples (accounting for evaporation rate), effects from exposure to light on results (UV, natural light, daylight, & light entering/exiting examination chamber), multiple sources of raw material (swine intestine), and software interface with hardware (serial monitor projecting invalid data collection, software freeze-ups).
ACKNOWLEDGEMENTS
The author would like to acknowledge mentor, Dr. Khan Wahid, Professor, College of Engineering, University of Saskatchewan, for guidance through this research project. In addition, I greatly appreciate all guidance on project development from PhD. students Shahim Vedaei and Mohammed Reza.
REFERENCES
Shim, K.-N., Jeon, S. R., Jang, H. J., Kim, J., Lim, Y. J., Kim, K. O., Song, H. J., Lee, H. S., Park, J. J., Kim, J. H., Chun, J., Park, S. J., Yang, D.-H., Min, Y. W., Keum, B., Lee, B.-I., & Korean Gut Image Study Group. (2017, March). Quality indicators for small bowel capsule endoscopy. Clinical endoscopy. Retrieved from https://www.ncbi.nlm.nih.gov/pmc/articles/PMC5398361/
U of S researcher honoured for next-generation "camera pill" to diagnose gut ailments. News. (2016, May 25). Retrieved from https://news.usask.ca/media-release-pages/2016/u-of-s-researcher-honoured-for-next-generation-camera-pill-to-diagnose-gut-ailments.php
Ghosh, T., Bashar, S. K., Alam, S., Wahid, K., & Fattah, S. A. (2014). A statistical feature based novel method to detect bleeding in wireless capsule endoscopy images. ResearchGate. Retrieved from https://www.researchgate.net/publication/269297225_A_statistical_feature_based_novel_method_to_detect_bleeding_in_wireless_capsule_endoscopy_images
Ghosh, T., Fattah, S. A., Wahid, K. A., Zhu, W.- P., & Ahmad, M. O. (2018, January 5). Cluster Based Statistical feature extraction method for automatic bleeding detection in wireless capsule endoscopy video. PubMed. Retrieved from https://pubmed.ncbi.nlm.nih.gov/29407997/
Ghosh, T., Bashar, S. K., Fattah, S. A., Shahnaz, C., & Wahid, K. A. (2014). A feature extraction scheme from region of interest of wireless capsule endoscopy images for automatic bleeding detection. Retrieved from https://www.researchgate.net/publication/290599126_A_feature_extraction_scheme_from_region_of_interest_of_wireless_capsule_endoscopy_images_for_automatic_bleeding_detection
Mohebbian, M., Sohag, H., Vedaei, S., Wahid, K. (2020). Automated Detection of Bleeding in Capsule Endoscopy using on-chip Multispectral Imaging Sensors. Retrieved from https://ieeexplore.ieee.org/document/9244221?utm_source=researcher_app&utm_medium=referral&utm_campaign=RESR_MRKT_Researcher_inbound
Khan, A. H., Sohag, H. A., Vedaei, S. S., Mohebbian, M. R., & Wahid, K. A. (2020, July). Automatic detection of intestinal bleeding using an optical sensor for wireless capsule endoscopy. Annual International Conference of the IEEE Engineering in Medicine and Biology Society. IEEE Engineering in Medicine and Biology Society. Annual International Conference. Retrieved from https://pubmed.ncbi.nlm.nih.gov/33018957/
PillCam™ SB 3 system. PillCam™ SB 3 System | Medtronic (CA).
Holland, K. (2018, July 28). Bleeding to death: Am I at risk, and how can I stop it? Healthline. Retrieved from https://www.healthline.com/health/bleeding-to-death
APPENDIX
(from left to right)
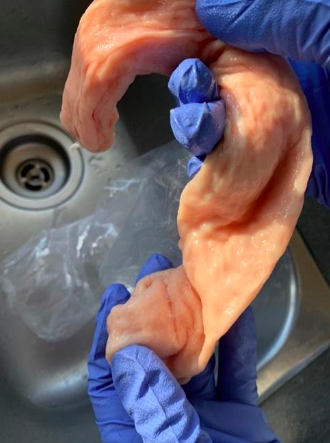
Figure 7: Cleaning of pig intestine.
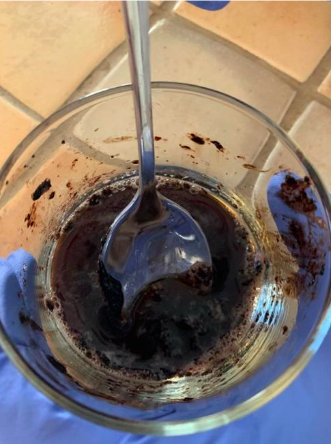
Figure 8: Creation of hemoglobin saturated solution.
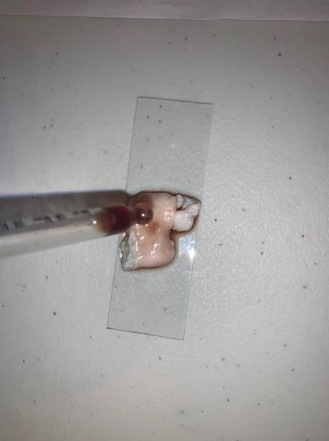
Figure 9: Adding hemoglobin to experimental sample of pig intestine.

Figure 10: Experiment workstation
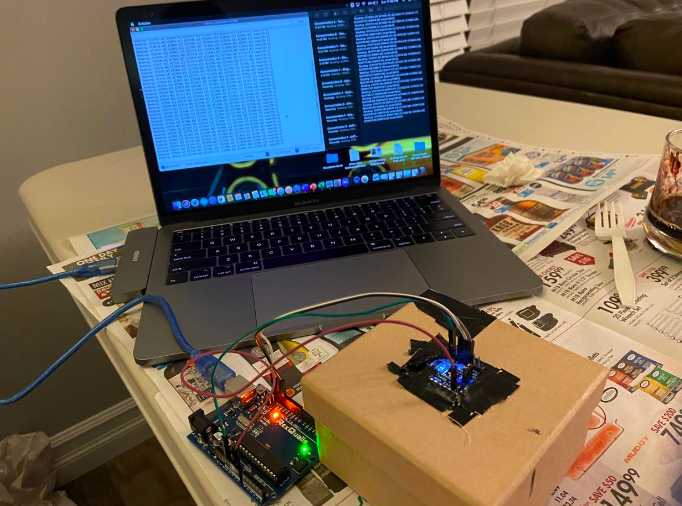
Figure 11: Experiment sample in testing

Figure 12: Demonstration of LED activation for spectral sensor.
ABOUT THE AUTHOR

Affaan Abid
My name is Affaan Abid and I am currently an 18-year-old student completing grade 12 from Saskatoon, SK. I have enjoyed participating in science fairs for the past seven years and am passionate about learning in the fields of medicine, technology, and engineering sciences. In my grade 10 year, I had researched developing a spectroscopy-based application capable of detecting potential gastrointestinal bleeding within the GI tract. I also advanced this research in my grade 11 year to use a similar application involving fluorescence imaging to help detect early-stage colorectal cancer within the GI tract. I am very passionate about searching for novel methods to improve our current ability for medical diagnosis to better understand disease and illness in humans.